The AI Marketing Measurement Problem: What Broke, What’s Emerging, and What to Test in 2026
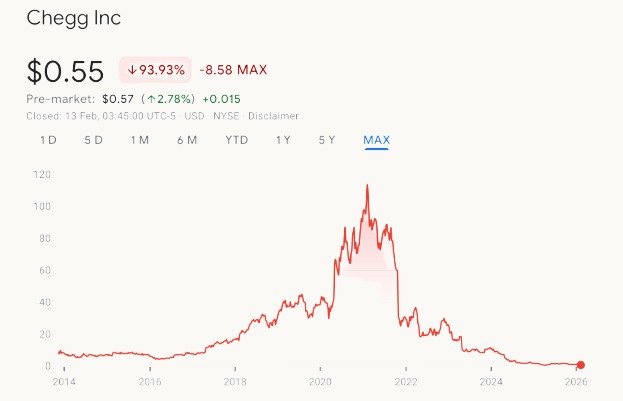
In October 2025, Chegg slashed 45% of its workforce. The education company’s market cap had collapsed from $14.7 billion to $156 million. A 99% destruction of value. The dashboards showed green. Traffic metrics looked fine. But AI had quietly become the first stop for homework help. By the time leadership understood what was happening, the business model was already dead.
This is the measurement crisis hitting every marketing team. Twenty years of measurement assumptions are breaking simultaneously. Here’s what’s happening, what the latest data shows, and the emerging metrics gaining traction. This is a living document updated as the data evolves, not a finished playbook.
1. The Problem: Could AI Replace Marketing Teams?
2. The Solution: The AI Marketing Framework
3. The Validation: The AI Marketing Measurement Problem
What’s Covered
What Broke: Three Simultaneous Crises
Three things happened at once. Each alone would require adaptation. Together, they broke the assumptions underlying two decades of marketing measurement.
Crisis 1: The Zero-Click Collapse
Traditional measurement assumed a simple flow: user searches, user clicks, user converts. That flow is breaking. According to Similarweb’s May 2025 analysis, zero-click searches hit 69% of all Google searches, up from 56% in May 2024. Semrush’s broader US dataset puts it at 58.5%. The exact number varies by methodology, but the direction is unanimous. When AI Overviews appear, the impact is severe: Ahrefs found a 58% reduction in organic CTR for position 1 results (up from 34.5% in their April 2025 study). Seer Interactive measured a 61% decline in organic CTR and 68% decline in paid CTR when AI Overviews are present.
| Metric | Value | Change |
|---|---|---|
| Zero-click search rate | 58.5% to 69% | Varies by methodology (Semrush, Similarweb) |
| AI Overviews prevalence | 13% to 47% of searches | Expanding rapidly (Semrush March 2025, Similarweb May 2025) |
| Organic CTR decline with AI Overview | 58% to 61% | Ahrefs Dec 2025: 58% for position 1. Seer Interactive: 61% overall |
| Zero-click rate with AI Overviews | 83% | vs. 34% without AI Overviews (Semrush) |
| Google traffic to publishers | Down 33% globally, 38% US | November 2024 to November 2025 (Chartbeat / Reuters Institute) |
HubSpot became the industry’s cautionary tale. According to HubSpot’s own analysis, their blog traffic dropped significantly as AI Overviews reshaped informational search. HubSpot CEO Yamini Rangan acknowledged the shift at INBOUND 2025, calling it a “traffic apocalypse” and noting that organic search traffic is “declining globally” because “AI overviews are giving answers, and fewer people are clicking through to websites.”
The casualties keep mounting: Chegg saw a 49% decline in non-subscriber traffic. Forbes experienced 60 to 80% decline in organic search visibility (largely driven by a Google manual action for Site Reputation Abuse targeting Forbes Advisor’s parasitic SEO, not AI disruption alone). Business Insider lost 55% of organic traffic, leading to 21% staff cuts.
But the aggregate picture is more nuanced than the worst cases suggest. A January 2026 analysis by Graphite using Similarweb data from 40,000+ US websites found organic traffic declined only 2.5% year-over-year, not the 25 to 60% often cited. Meanwhile, Chartbeat data for 2,500+ publisher sites showed Google search traffic to publishers down 33% globally and 38% in the US (November 2024 to November 2025). The reconciliation: the aggregate masks category-specific pain. News publishers and informational content sites bear the brunt. Mid-tier sites with commodity content are hit hardest. Large commercial sites with transactional intent are largely holding steady.
Crisis 2: The Attribution Meltdown
Even when users do click, we often can’t track them anymore. 39% of marketers cite measuring attribution as a top challenge according to Gartner’s 2024 Tech Marketing Benchmarks Survey. Apple’s App Tracking Transparency reduced Facebook’s attribution visibility by up to 50% for some advertisers. And with Safari and Firefox already blocking third-party cookies, a significant share of internet traffic is already unaddressable by traditional trackers.
Multi-touch attribution (MTA), the methodology marketers relied on for granular journey mapping, is breaking apart. The number of touchpoints before conversion varies wildly by industry, from 8 for simple purchases to over 200 for enterprise B2B SaaS. But the direction is consistent: buyers touch more channels than ever, and many of those touchpoints now happen in environments we can’t track: AI conversations, private messages, podcast mentions, voice assistants.
AI adds a new layer to this breakdown. When a user asks ChatGPT “best project management tool for remote teams,” gets a recommendation, then searches the brand name directly a week later, GA4 records a “Direct” or “Organic” visit. The AI influence is invisible. Conductor’s 2026 benchmark tracks AI referral traffic at just over 1% of all visits, but this only captures users who click a link inside an AI response. The larger category, AI-influenced visits that arrive through other channels, has no standard measurement method. This is why 46.9% of US marketers plan to increase investment in Marketing Mix Modeling, which infers impact through correlation rather than user-level tracking.
Crisis 3: Discovery Fragmentation
Users aren’t just leaving Google. They’re discovering brands through entirely new channels that our measurement systems weren’t built to track. ChatGPT reached 800 million weekly active users as of October 2025 and receives over 1 billion queries daily. Perplexity processes 780 million queries per month, up 239% from August 2024.
| Platform | Users | Market Share |
|---|---|---|
| ChatGPT | 800 million weekly active (October 2025) | 64.6% traffic share (Jan 2026, down from 86.6% a year prior) |
| Google Gemini | 450 million monthly active | 22% traffic share (Jan 2026, up from 5.3%). Referrals up 388% YoY |
| Perplexity AI | 22 to 45 million active | Growing (+370% YoY). 780M queries/month |
| Claude | 20 million monthly active | +190% YoY growth |
The market share shift is accelerating. ChatGPT still dominates, but its share of AI referral traffic dropped from 86.6% to 64.6% in a single year. Gemini surged from 5.3% to 22% of AI traffic share, with referrals up 388% year-over-year. This fragmentation compounds the measurement problem: you can’t optimize for a single AI platform the way you once optimized for Google alone.
Here’s the critical shift: Bain found that 68% of LLM users rely on AI for researching and summarizing information, with 42% using AI for shopping recommendations. A follow-up study found 30 to 45% of US consumers now use generative AI for product research and comparison. When a user asks ChatGPT for a software recommendation, acts on it, and later visits your site directly, GA4 attributes this to “Direct” traffic. The AI’s influence is invisible.
These are all symptoms of one structural shift: discovery is moving from retrieval to generation. For twenty-five years, users queried a search engine, the engine retrieved indexed documents, and marketers optimized to appear at the top. Now users query an AI. The AI generates a synthesized answer, often without citing sources, often without sending traffic anywhere. The marketer’s job is… what, exactly? That’s the question we’re trying to answer.
Where We Are Today (February 2026)
Let me be direct about the state of knowledge: we’re figuring this out in real time. The tools are first-generation. The metrics are directional, not precise. The methodology is being built through experimentation. Anyone claiming certainty is selling something.
What We Can Measure (Imperfectly)
AI Referral Traffic: GA4 can track some AI-referred traffic, but the data is incomplete. You need custom dimensions and regex filters for LLM domains. ChatGPT, Perplexity, Claude, and Gemini each behave differently. Even then, you’re only seeing direct clicks from AI responses. The larger influence remains invisible.
Brand Mentions in LLM Responses: A new category of tools has emerged to track whether your brand appears in AI-generated answers. Platforms like Semrush, Profound, Peec AI, and Otterly now offer “AI visibility” or GEO tracking. The methodology is polling-based, inspired by election forecasting. You define queries, run them against AI platforms regularly, and track how often your brand appears.
Share of Voice Across AI Platforms: Top-performing brands capture 15% or more share of voice across their core query sets, with enterprise leaders in specialized verticals reaching 25 to 30%. But consistency remains elusive: citation drift of 40 to 60% monthly is typical, and only 30% of brands remained visible in back-to-back responses in one study. Approximately 250 publications are needed to significantly influence AI brand perception. The “fixed #1 position” era of SEO does not exist in AI.
The Conversion Paradox
Here’s where it gets interesting. Ahrefs published data showing AI search visitors convert at 23x higher rates than traditional organic search on their own site. That number got a lot of attention. But the broader data tells a more nuanced story.
| Source | AI vs. Organic Conversion | Context |
|---|---|---|
| Ahrefs (own site) | 23x better | SaaS tool, high-intent niche queries |
| Seer Interactive (2025) | ChatGPT 15.9%, Perplexity 10.5%, Claude 5% | Conversion rates by AI platform |
| RankScience (2025) | 14.2% vs. Google’s 2.8% (about 5x) | Cross-industry aggregate |
| Conductor (2026 benchmark) | 2x better | 13,770 domains |
| SE Ranking (2025) | 68% longer time on site | Engagement metric, not conversion |
| Amsive (973 ecommerce sites) | ChatGPT converts worse than Google for ecommerce | Broad ecommerce, casual browse intent |
Why the variance? Intent quality. Ahrefs sees 23x because their AI traffic comes from high-intent, niche queries on a specialized SaaS tool. Users arriving via “best backlink checker” in ChatGPT know exactly what they want. Amsive’s ecommerce data shows the opposite: ChatGPT referrals convert worse than Google search, email, and affiliate traffic for broad retail queries. The 4-5x average from RankScience and Seer likely reflects a more realistic cross-industry picture. Your mileage depends on your industry, query specificity, and how precisely AI platforms match visitor intent to your offering.
What’s consistent across studies: engagement signals are higher. According to SE Ranking’s 2025 study, AI referrals show 68% longer time on site than traditional organic search. Visitors who arrive from AI tend to be more intent-driven, even when conversion rates vary.
But here’s the reality check: AI traffic accounts for just over 1% of all website visits, according to Conductor’s 2026 AEO/GEO Benchmarks Report analyzing 13,770 domains. Of that 1%, ChatGPT drives 87.4% of tracked AI referrals (though its overall platform market share is declining as Gemini grows). Google still sends vastly more traffic than all AI platforms combined. The conversion rates are compelling. The volume is growing but still small.
What’s Emerging: New Approaches
The industry is adapting. New frameworks and methodologies are emerging. Some will prove useful. Some won’t survive contact with reality. The stakes are real: brands cited in AI Overviews earn 35% more organic clicks and 91% more paid clicks than uncited brands for the same queries. Getting this right has measurable upside.
For those following this series: measurement is where the AI Marketing Framework’s Optimisation layer lives. The metrics we track here become the feedback signals that refine Foundation and Execution. Share of Model becomes an input for agents auto-adjusting content for citation factors. The curated prompt set maps directly to buyer Jobs-to-be-Done. Without working measurement, the entire system flies blind.
The Hybrid Measurement Framework
The consensus emerging among sophisticated marketers: no single methodology will work. You need a hybrid approach.
| Method | Best For | Limitation |
|---|---|---|
| Marketing Mix Modeling (MMM) | Strategic budget allocation | Requires 18+ months historical data |
| Incrementality Testing | Proving causality | Requires control groups, opportunity cost |
| Multi-Touch Attribution (MTA) | Real-time campaign optimization | Breaking due to privacy changes |
The emerging best practice: MMM for strategic planning, incrementality testing for ground truth validation, MTA for tactical optimization where still viable. 46.9% of US marketers plan to invest more in MMM in 2026.
What Seems to Influence AI Citations
The research on what makes content more likely to be cited by LLMs is still early. But patterns are emerging. Traditional SEO signals show weak correlation:
| Factor | Correlation with AI Citations |
|---|---|
| YouTube mentions | Highest (new finding) |
| Branded web mentions | 0.527 to 0.628 |
| Brand search volume | 0.334 to 0.466 |
| Backlinks | Weak |
| Domain Authority | Weak to negative |
This is counterintuitive. The signals that drove SEO success for two decades show minimal correlation with LLM citations. What does seem to matter:
- Freshness: 85% of AI Overview citations come from content published 2023 to 2025. 44% from 2025 alone. Content updated within 30 days gets 3.2x more citations than stale pages.
- Structure: Clear headings, Q&A formats, tables, and lists. URLs cited by ChatGPT averaged 17x more list sections than uncited ones. Consistent heading levels correlate with 40% higher citation likelihood (Lily Ray/Amsive). Comparison tables boost citations by 32.5%.
- Schema markup: Sites with structured data see up to 30% higher visibility in AI overviews.
- Answer-first formatting: Lead with the answer in 40 to 60 words, then explain.
- Original data and research: Proprietary insights and statistics are highly cited.
- Video presence: YouTube is the single most cited content format across all verticals in AI responses, ahead of text-based pages.
Cross-Platform Differences
Each AI platform behaves differently. According to Ahrefs’ ChatGPT citation analysis:
| Platform | Primary Citation Sources |
|---|---|
| ChatGPT | Wikipedia (47.9%), Reddit (11.3%), Forbes (6.8%) |
| Perplexity | Reddit (46.7%), YouTube (13.9%), Gartner (7.0%) |
| Google AI Overviews | Reddit (21%), YouTube (18.8%), Quora (14.3%) |
The overlap between platforms is strikingly low. Only 11% of domains cited by ChatGPT also appear in Perplexity citations for the same queries. According to Ahrefs (August 2025), 80% of URLs cited across ChatGPT, Perplexity, Copilot, and AI Mode do not rank in Google’s top 100 results for the original query. Surfer SEO found that 68% of pages cited in AI Overviews are not in the top 10 organic results. And 28.3% of ChatGPT’s most cited pages have zero organic visibility at all. Optimizing for Google alone won’t get you cited in AI. Each platform requires its own strategy.
The Metrics That Matter
These aren’t the final metrics. They’re the metrics gaining the most traction across early adopters. Here’s what each one measures, how it works, and where it breaks down.
Hypothesis 1: Share of Model (SoM)
What percentage of LLM responses mention your brand for a defined set of high-intent queries? Share of Model is the AI-native equivalent of Share of Voice. The concept was introduced by Jack Smyth at Jellyfish in 2024, and has since become the leading candidate for an AI visibility metric. If 30 to 45% of consumers now use AI for product research, and that percentage is growing, then presence in AI responses is becoming a leading indicator of brand consideration.
This metric is gaining rapid adoption. Jellyfish launched a dedicated Share of Model platform in late 2024, and multiple tool vendors (Semrush, SE Ranking, Otterly, Visalytica) now offer equivalent tracking. Early benchmarks suggest established brands achieve a Citation Frequency Rate of 15 to 30% for their core queries, while newcomers land at 5 to 10%. Growth targets of 2 to 3 percentage points monthly are considered healthy. BrightEdge reports 60% of marketing teams plan to reallocate SEO budgets toward AI search optimization by 2026.
Important caveat: Not all mentions are equal. A brand cited as a cautionary example (“unlike Company X, which failed to…”) is worse than no mention at all. Share of Model needs a sentiment dimension: positive citations, neutral citations, and negative citations should be tracked separately. A rising SoM driven by negative-context mentions is a warning signal, not a win.
How to track it: Tools like Brand Monitor, Otterly, and Semrush track mentions across ChatGPT, Perplexity, Claude, and Gemini. Run a defined query set weekly and track share over time, with manual sentiment tagging on a monthly sample.
Hypothesis 2: Curated Prompt Tracking
Claim: If you track a curated set of 50 to 100 prompts weekly across AI platforms, you can detect meaningful Share of Model changes within 8 weeks. Success: Prompt tracking surfaces citation trends that correlate with branded search lift (r > 0.3). Failure: Citation variance is too high to distinguish signal from noise at this sample size, or weekly polling produces no actionable patterns within two quarters.
The methodology is polling-based, inspired by election forecasting. You can’t track 50,000 keywords in AI the way you could in SEO. The responses are too variable. But you can track whether you show up for the queries that matter most. Seer Interactive published a free template for this approach using ChatGPT inside Google Sheets, and tools like Seer’s GenAI Answer Tracking, Otterly, and SE Ranking’s ChatGPT Visibility Tracker now automate the process across multiple LLMs.
| Intent Type | Sample Queries |
|---|---|
| Definition | What is an AI marketing operator? What is agentic marketing? |
| Problem | Why isn’t my AI marketing working? Why is AI automation expensive? |
| Solution | How do I measure AI marketing ROI? How to build AI marketing systems? |
| Tactical | How do I get cited by AI? Best AI marketing measurement tools? |
| Strategic | What should a CMO know about AI? AI marketing framework for B2B? |
| Comparison | YourBrand vs Competitor? AI marketing platform vs agency? HubSpot vs Salesforce for AI? |
The Practice: Authority Engineering
Share of Model tells you where you stand. Curated prompt tracking tells you how you’re trending. But what actually improves your citation rate? The emerging discipline is Generative Engine Optimization (GEO), a term formalized by researchers at Princeton, Georgia Tech, Allen Institute for AI, and IIT Delhi. Their study demonstrated that specific content optimizations can boost visibility in AI responses by up to 40%. The top-performing methods: adding cited sources, incorporating statistics, and including quotations from credible authorities.
I call the applied version of this Authority Engineering: the practice of building machine-readable trust so AI systems can parse, verify, and cite your content. It draws on three pillars from the GEO research and industry practice:
- Content architecture: Clear heading hierarchy, answer-first structure, comparison tables. Content with proper schema shows 30 to 40% higher visibility in AI-generated answers. The Princeton study found that content structured with statistics improved citations by 30 to 40% on the Position-Adjusted Word Count metric.
- Entity clarity: Consistent schema markup, brand naming, and structured data across your web presence. As Search Engine Land notes, AI systems cross-reference signals from multiple sources. When signals are consistent, AI systems categorize and reference your brand with greater confidence.
- Citation cultivation: Appearing in sources LLMs trust. Ahrefs’ analysis of 75,000 brands found that web mentions (correlation: 0.664) predict AI visibility far better than traditional backlinks (0.218) or Domain Rating (0.326). The AI model reads the internet, not just the link graph.
Authority Engineering is not a metric. It’s what you do to improve the metrics above. Think of SoM as the scoreboard and Authority Engineering as the training plan.
Hypothesis 4: Bridging Visibility to Revenue
The hardest question: does AI visibility drive revenue? The emerging approach is a testable causal chain:
- Share of Model lift → More mentions in AI responses for target queries
- Branded search volume lift → Users who discover you via AI later search your brand directly
- Incrementality test → Compare conversion rates on AI-optimized content cohorts vs. control
If the chain holds, there’s a measurable path from AI visibility to pipeline. If it breaks at any link, you learn where. This is the framework early adopters are using to validate AI marketing spend.
Time lag warning: Each link in this chain has latency. SoM changes take weeks to register as branded search lift. Branded search lift takes months to flow through to pipeline. Expect a 6 to 9 month delay from first AI visibility improvements to measurable revenue impact. Set expectations accordingly. If leadership needs faster proof, use incrementality testing on a shorter cycle. In the interim, track traffic quality as an early signal. If AI-referred visitors convert at higher rates than organic (the cross-industry data suggests 4 to 5x), rising quality offsets flat volume. That gives leadership something concrete before the full revenue proof matures.
Risks and Failure Modes
Before you dive in, understand what can go wrong:
- Polling variance: Different LLMs update at different cadences. ChatGPT’s training data lags. Perplexity pulls live. Your Share of Model will fluctuate based on when and how you measure.
- Gaming risks: Over-optimizing for AI citations (keyword stuffing, entity cramming) can hurt human readability. If your content reads like it was written for robots, humans won’t share it, and LLMs will eventually deprioritize it.
- Citation volatility: Only 30% of brands remained visible in back-to-back responses in one study. Research confirms 40 to 60% citation drift monthly. The “fixed #1 position” era of SEO does not exist in AI. Consistency is the exception, not the rule.
- Platform commercialization: OpenAI launched ads in ChatGPT in February 2026. Google’s AI Mode shows a 93% zero-click rate. As AI platforms monetize, the relationship between organic visibility and paid placement will shift, creating new measurement blind spots.
- Tool immaturity: Every AI visibility tool is first-generation. Methodologies aren’t standardized. Results across platforms won’t match. Budget for learning curves.
What You Can Do Today
The methodology is too immature for a finished playbook. But there are practical steps you can take now.
Start Tracking (Even Imperfectly)
Set up AI referral tracking in GA4. Create custom dimensions for AI referral traffic. Add custom channel groups with AI platforms as sources. Apply regex filters for LLM domains. For step-by-step walkthroughs, see Loves Data’s GA4 guide or Two Octobers’ technical walkthrough.
Run manual AI visibility audits. Choose 10 to 20 queries your target customers might ask AI. Run them through ChatGPT, Perplexity, Claude, and Gemini monthly. Screenshot the responses. Note who gets cited. Compare over time to identify patterns.
Track branded search lift. Monitor branded search volume in Google Search Console. Look for correlations with AI visibility changes. This is indirect but potentially meaningful.
Audit Your Citation-Readiness
- Structure: Is your content organized with clear headings? Do you use Q&A format, tables, and lists?
- Freshness: When was your key content last updated? Is it from 2025, or older?
- Original data: Do you have proprietary research or statistics? Are data ownership cues clear?
- Schema markup: Do you have JSON-LD structured data? FAQPage, Article, Organization schemas?
Build the Minimum Viable Stack
| Component | Purpose | Options |
|---|---|---|
| AI visibility tracking | Monitor brand mentions in LLM responses | Brand Monitor, Otterly, HubSpot AEO Grader (free) |
| GA4 with AI dimensions | Track AI referral traffic | Google Analytics 4 (free) |
| Query tracking spreadsheet | Document curated prompt tracking results | Google Sheets, Notion |
| Content audit template | Assess citation-readiness | Custom template |
What’s Next
This article is a living document, updated as the data changes. The February 2026 update added significant new conversion rate data, updated zero-click and CTR statistics, expanded citation factor research, and reflected the ChatGPT market share shift as Gemini surges. That’s the only honest way to write about a topic this unsettled. Show the work. Skip the certainty.
If you’re tracking curated prompt results or Share of Model data, I want to hear what you’re learning. Share your results on LinkedIn or email me directly. The more data points across the industry, the faster we all learn.
Key Concepts
Each term links to a dedicated definition page with full context and implementation guidance. See the complete AI Marketing Definitions glossary.
| Term | Definition |
|---|---|
| Zero-Click Search | Searches where users get answers directly in results without clicking through. 58.5% to 69% of Google searches now end without a click. Jumps to 83% when AI Overviews appear. |
| Share of Model | The percentage of LLM responses that mention your brand for a defined set of high-intent queries. The AI-native equivalent of Share of Voice. |
| Curated Prompt Tracking | A polling-based methodology using 50 to 100 prompts representing your target buyer’s questions, tracked weekly across AI platforms. The foundation of Share of Model tracking. |
| Authority Engineering | The practice of building machine-readable trust so AI systems can parse, verify, and cite your content. Combines content architecture, entity clarity, and citation cultivation. Grounded in Generative Engine Optimization (GEO) research. |
| Marketing Mix Modeling (MMM) | Statistical modeling that estimates marketing impact through correlation rather than user-level tracking. Re-emerging as deterministic attribution breaks down. |
| Incrementality Testing | Experimental methodology that measures true causal impact by comparing test and control groups. The closest to “proof” in modern marketing measurement. |
Explore the AI Marketing System
→ Could AI Replace Marketing Teams?
→ The AI Marketing Framework
→ AI Marketing Definitions
→ Operator Logs
Frequently Asked Questions
What is zero-click search and why does it matter for marketing?
Zero-click search occurs when users get their answer directly in search results without clicking through to any website. Estimates range from 58.5% (Semrush) to 69% (Similarweb) of Google searches ending without a click. When AI Overviews appear, that rate jumps to 83%. This matters because traditional measurement assumes users click through to your site. If they get answers from AI Overviews or featured snippets, your traffic metrics miss the full picture of brand engagement.
How do I track AI referral traffic in Google Analytics 4?
Create custom channel groups with regex filters for LLM domains. Use patterns like chatgpt, gemini, copilot, and perplexity. Add custom dimensions for AI referral traffic. Note that some AI platforms don’t pass referrer data consistently, so your numbers will be incomplete. The larger influence, when users discover your brand through AI and later search directly, remains invisible.
What is Share of Model and how is it measured?
Share of Model measures what percentage of LLM responses mention your brand for a defined set of high-intent queries. It’s the AI-native equivalent of Share of Voice, introduced by Jack Smyth at Jellyfish in 2024. You measure it using polling-based methodology: define a curated set of 50 to 100 prompts, run them against multiple AI platforms weekly, and track how often your brand appears. Early benchmarks show established brands achieving 15 to 30% Citation Frequency Rate, with 2 to 3 percentage points monthly growth considered healthy.
Should I abandon SEO for AI optimization?
No. Google still sends vastly more traffic than all AI platforms combined. AI referral traffic accounts for just over 1% of all website visits according to Conductor’s 2026 benchmark. AI traffic is growing fast but remains a small percentage of total web traffic. The right approach is hybrid: maintain SEO fundamentals while adding AI visibility tracking and content optimization for citations.
What content factors correlate with AI citations?
Research shows weak correlation between traditional SEO signals and AI citations. What does correlate: content freshness (content updated within 30 days gets 3.2x more citations), clear structure with consistent heading levels (40% higher citation likelihood), comparison tables (32.5% boost), schema markup (up to 30% higher visibility), answer-first formatting in the first 40 to 60 words, and original data or research. YouTube and video content show the highest correlation across all verticals.
How accurate is AI traffic conversion data?
Studies show wildly different results depending on industry. Ahrefs reports 23x better conversions for their SaaS tool. RankScience finds a 5x average across industries. Seer Interactive shows ChatGPT at 15.9%, Perplexity at 10.5%. But Amsive’s ecommerce study shows ChatGPT referrals convert worse than Google for retail. The cross-industry average is likely 4 to 5x better for high-intent queries. What’s consistent: AI referrals show 68% longer time on site.
What is curated prompt tracking for AI visibility?
Curated prompt tracking is a polling-based methodology for measuring AI brand visibility. You define a set of 50 to 100 prompts representing your target buyer’s actual questions, then run them against ChatGPT, Perplexity, Claude, and Gemini weekly. Track how often your brand appears and which competitors get cited. Seer Interactive published a free template for this approach, and tools like Otterly and SE Ranking now automate it. This focused approach provides more actionable insight than trying to monitor the entire AI surface area.
What is Authority Engineering?
Authority Engineering is the practice of building machine-readable trust so AI systems can parse, verify, and cite your content. It draws on Generative Engine Optimization (GEO) research from Princeton, Georgia Tech, and the Allen Institute for AI, which showed that adding cited sources, statistics, and structured data can boost AI visibility by up to 40%. The practice combines three pillars: content architecture (structure, freshness, original data), entity clarity (schema markup, brand consistency), and citation cultivation (appearing in sources LLMs trust).